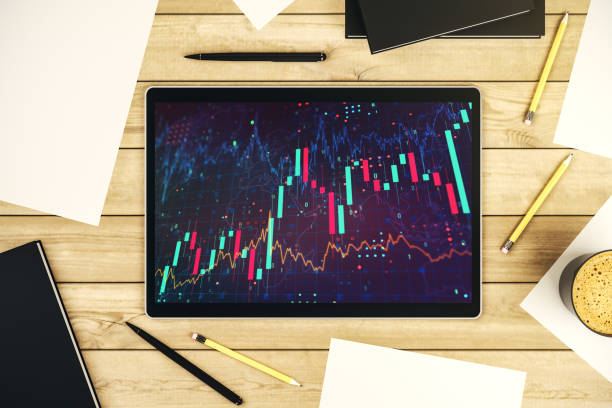
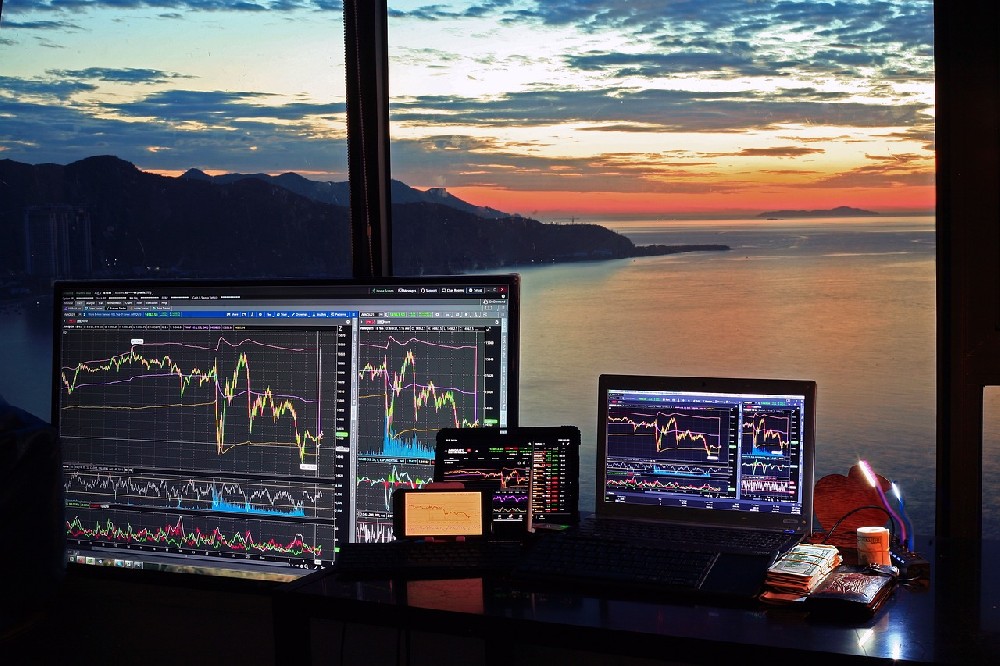
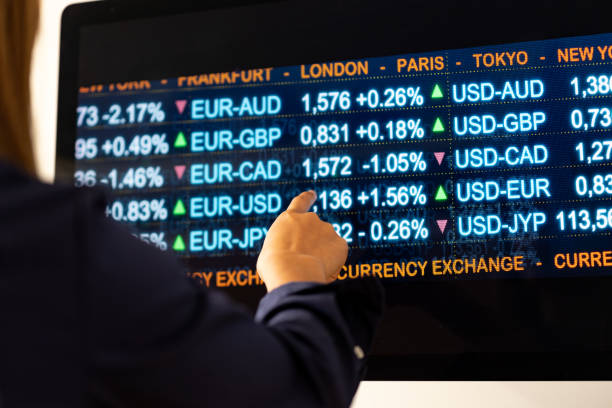
International futures are contracts that obligate the buyer or seller to exchange an asset or commodity at a specified future date and price. They are used for hedging, speculation, and arbitrage purposes in the global market. International futures can be based on various underlying assets, such as currencies, commodities, indices, stocks, bonds, and interest rates.
To trade international futures effectively, traders need to use indicators that can help them analyze the market trends, momentum, volatility, and volume of the underlying assets. Indicators are mathematical calculations or graphical tools that are derived from price or volume data and provide signals for potential market movements.
There are many types of indicators that can be used for international futures trading, but some of the most common ones are:
l lMoving averages: These are lines that plot the average price of an asset over a certain period of time. They can help identify the direction and strength of the trend, as well as potential support and resistance levels. Moving averages can be simple, exponential, weighted, or smoothed, depending on how they assign weights to the price data.
l lFibonacci retracements: These are horizontal lines that divide the price range of an asset into ratios based on the Fibonacci sequence. They can help identify the possible reversal points or pullbacks of the price within a trend. The most commonly used ratios are 23.6%, 38.2%, 50%, 61.8%, and 78.6%.
l lParabolic stop and reverse (PSAR): This is a series of dots that appear above or below the price of an asset. They can help indicate the direction and momentum of the trend, as well as potential entry and exit points. The dots move closer to the price as the trend accelerates and farther away as the trend decelerates.
l lBollinger bands: These are bands that surround the price of an asset and indicate its volatility. They consist of a simple moving average and two standard deviations above and below it. They can help identify the periods of high and low volatility, as well as potential breakouts or reversals of the price.
l lRelative strength index (RSI): This is an oscillator that measures the speed and magnitude of the price changes of an asset. It ranges from 0 to 100 and indicates the overbought or oversold conditions of the market. Generally, a reading above 70 suggests that the market is overbought and a reading below 30 suggests that the market is oversold.
These are some of the indicators that can be useful for international futures trading, but they are not the only ones. Traders should use a combination of indicators that complement each other and suit their trading style and objectives. They should also be aware of the limitations and risks of using indicators, such as false signals, lagging effects, and curve-fitting. Indicators are not a substitute for fundamental analysis, market news, and risk management.


