Futures are derivative contracts that obligate the parties to buy or sell an asset at a predetermined price and date in the future. Futures traders can use futures to speculate on the future direction of the price of an asset, or to hedge their risk exposure to an adverse price movement of an asset.
However, futures trading also involves significant challenges, as the price of the underlying asset can fluctuate unpredictably and rapidly. Therefore, futures traders need to be able to tell when prices have reached a top, or a peak level, before they reverse and decline. This can help them to take profits, exit losing positions, or enter short positions to profit from the downward trend.
There is no definitive way to tell when prices have reached a top, as the market is influenced by many factors, such as supply and demand, news, sentiment, and technical analysis. However, there are some indicators and tools that can help futures traders to identify and trade potential tops, such as:
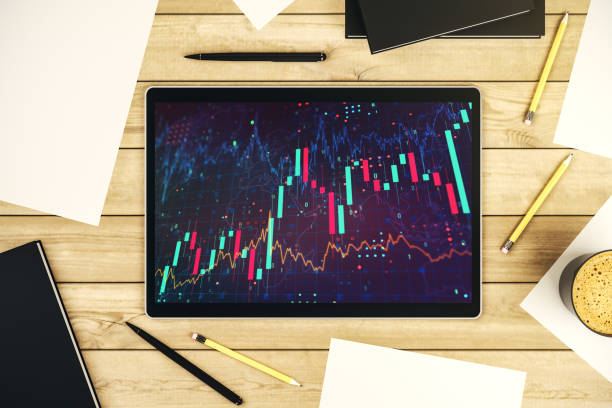
Price patterns: Price patterns are formations that appear on the price charts of the underlying asset and the futures contract, and that indicate the possible direction and strength of the price movement. Some of the common price patterns that can signal a top are double tops, triple tops, head and shoulders, and rising wedges. These patterns show that the price is facing resistance at a certain level, and that the buyers are losing momentum and the sellers are gaining control.
Volume: Volume is the number of contracts or shares traded during a given period of time. Volume can help futures traders to confirm the validity and significance of a price pattern or a price breakout. Generally, a high volume indicates a strong price movement, while a low volume indicates a weak price movement. Therefore, if the price reaches a new high on a low volume, it can suggest that the buyers are exhausted and the sellers are ready to take over. Conversely, if the price breaks below a support level on a high volume, it can indicate that the sellers are dominant and the buyers are retreating.
Oscillators: Oscillators are technical indicators that measure the momentum and the overbought or oversold conditions of the price. Oscillators can help futures traders to detect when the price is deviating from its normal range, and when it is likely to reverse. Some of the common oscillators that can signal a top are relative strength index (RSI), stochastic, and moving average convergence divergence (MACD). These oscillators show when the price is overbought, meaning that it has risen too much and too fast, and that it is due for a correction. They can also show when the price is diverging from the oscillator, meaning that the price is making a new high while the oscillator is making a lower high, and that the price is losing momentum and strength.
These are some of the indicators and tools that can help futures traders to tell when prices have reached a top, but they are not the only ones. Futures traders should use a combination of indicators and tools that suits their trading style, objectives, and risk tolerance. They should also follow the rules and practices of futures trading, such as regulation, membership, contracts, trading, and risk management. By doing so, they can enhance their trading efficiency and profitability.
Search Restaurant
Related Recommendation
How To
Related News
What are the rules and practices of futures trading?
Futures trading is a form of financial speculation that involves buying and selling contracts that represent the future delivery of an asset, such as a commodity, a currency, an index, or a stock. Futures traders aim to profit from the price movements of the underlying asset, without actually owning COMMODITIES & FFUTURES2026-06-24

How do futures traders review their trading?
Futures trading is a form of financial speculation that involves buying and selling contracts that represent the future delivery of an asset, such as a commodity, a currency, an index, or a stock. Futures traders aim to profit from the price movements of the underlying asset, without actually owning COMMODITIES & FFUTURES2026-06-14

What does the stock index futures settlement price mean?
Stock index futures are derivative contracts that obligate the parties to buy or sell an index value at a predetermined price and date in the future. Stock index futures can be used to speculate on the future direction of the market, or to hedge the risk of adverse price movements of a portfolio.The COMMODITIES & FFUTURES2026-05-27
How to have a good defensive strategy in futures trading?
Futures trading is a form of financial speculation that involves buying and selling contracts that represent the future delivery of an asset, such as a commodity, a currency, an index, or a stock. Futures traders aim to profit from the price movements of the underlying asset, without actually owning COMMODITIES & FFUTURES2026-06-08
Futures night trading hours
Futures are contracts that obligate the buyer or seller to exchange an asset or commodity at a specified future date and price. They are used for hedging, speculation, and arbitrage purposes in the global market. Futures can be based on various underlying assets, such as currencies, commodities, ind COMMODITIES & FFUTURES2026-05-16

What are the characteristics of commodities?
Commodities are basic goods that are used in commerce and that are interchangeable with other goods of the same type. Commodities have some distinctive characteristics that differentiate them from other types of assets, such as stocks or bonds. Some of the characteristics of commodities are:They are COMMODITIES & FFUTURES2026-06-18
Can you do futures with as little stop loss as possible?
Futures trading is a form of financial speculation that involves buying and selling contracts that represent the future delivery of an asset, such as a commodity, a currency, an index, or a stock. Futures traders aim to profit from the price movements of the underlying asset, without actually owning COMMODITIES & FFUTURES2026-06-03

What are delivery instructions?
Delivery instructions are specific instructions that a buyer or a seller of a futures contract gives to their broker or clearing member regarding the delivery or receipt of the underlying asset. Delivery instructions are required when a futures contract reaches its expiration date and the parties in COMMODITIES & FFUTURES2026-06-28