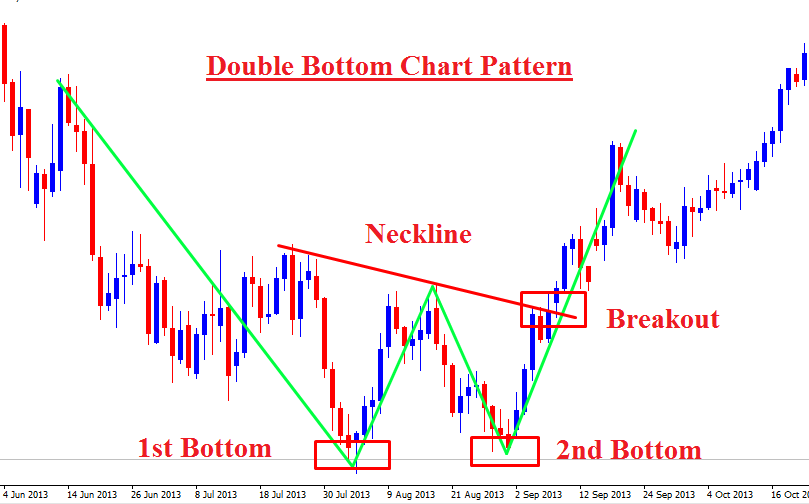
Double bottom: This pattern resembles the letter W, where the price falls to a low, rebounds, falls again to a similar low, and then rises above the previous peak. The two lows form the bottom of the W, and the peak between them is the neckline. A breakout above the neckline confirms the reversal. For example, see the chart of Apple Inc. (AAPL) from October 2023 to January 2024.
Triple bottom: This pattern is similar to the double bottom, but with three lows instead of two. The price falls to a low, rebounds, falls again to a similar low, rebounds, falls a third time to a similar low, and then rises above the previous peak. The three lows form the bottom of the pattern, and the peak between them is the neckline. A breakout above the neckline confirms the reversal. For example, see the chart of Microsoft Corporation (MSFT) from July 2023 to October 2023
Head and shoulders bottom: This pattern resembles an inverted head and shoulders, where the price falls to a low, rebounds, falls to a lower low, rebounds, falls to a higher low, and then rises above the previous peak. The lower low forms the head, and the two higher lows form the shoulders. The peak between the head and the shoulders is the neckline. A breakout above the neckline confirms the reversal. For example, see the chart of Amazon.com, Inc. (AMZN) from April 2023 to July 2023.
Rounding bottom: This pattern resembles a bowl or a saucer, where the price gradually declines, reaches a low, and then gradually rises. The low forms the bottom of the pattern, and the rise forms the right side of the pattern. The pattern is usually long-term and can span several months or years. A breakout above the previous high confirms the reversal. For example, see the chart of Tesla, Inc. (TSLA) from January 2023 to November 2023.
V-shaped bottom: This pattern resembles the letter V, where the price sharply falls to a low and then sharply rises. The low forms the bottom of the pattern, and the rise forms the right side of the pattern. The pattern is usually short-term and can span a few days or weeks. A breakout above the previous high confirms the reversal. For example, see the chart of Netflix, Inc. (NFLX) from September 2023 to October 2023.
These are some of the classic bottom forms of stocks that can help you identify potential reversals and opportunities to buy low and sell high. However, you should always use other technical indicators and fundamental analysis to confirm your trading decisions and manage your risk. I hope this information was helpful to you.


