There are different types of moving averages, such as simple, exponential, and weighted. The simple moving average (SMA) is the most basic type, which gives equal weight to each price in the period. The exponential moving average (EMA) gives more weight to the recent prices, making it more responsive to the changes in the price. The weighted moving average (WMA) gives more weight to the prices according to a specific formula, such as the linear or the triangular weighting.

Some of the basic techniques for using the moving average are:
Trend identification: You can use the moving average to identify the trend of a stock by looking at its slope and direction. A rising moving average indicates that the stock is in an uptrend, while a falling moving average indicates that the stock is in a downtrend. You can also use multiple moving averages with different periods to confirm the trend. For example, if a shorter-term moving average crosses above a longer-term moving average, it is a bullish signal that the stock is in an uptrend. Conversely, if a shorter-term moving average crosses below a longer-term moving average, it is a bearish signal that the stock is in a downtrend.
Support and resistance: You can use the moving average to find the support and resistance levels of a stock by looking at its interaction with the price. Support is the level where the price tends to bounce up from, while resistance is the level where the price tends to fall down from. The moving average can act as a dynamic support or resistance level, depending on the trend. For example, in an uptrend, the moving average can act as a support level, where the price tends to find buyers and bounce up. In a downtrend, the moving average can act as a resistance level, where the price tends to find sellers and fall down.
Entry and exit: You can use the moving average to find the optimal entry and exit points for a stock by looking at its signals and patterns. There are many ways to use the moving average for entry and exit, such as breakouts, pullbacks, crossovers, and divergences. For example, a breakout is when the price moves above or below the moving average, indicating a change in the trend and momentum. A pullback is when the price retraces or corrects a portion of its previous move, indicating a pause or consolidation in the trend. A crossover is when the price or another moving average crosses the moving average, indicating a change in the direction and strength of the trend. A divergence is when the price and the moving average move in opposite directions, indicating a weakening or reversal of the trend.
These are some of the basic techniques for using the moving average, but they are not the only ones. You should also use other technical indicators and fundamental analysis to complement and confirm your trading decisions and manage your risk. You can learn more about the moving average and how to use it from the resources I found for you:
- This article provides an overview of the moving average, its types, and its uses.
- This article provides a guide on how to use the moving average for different strategies, such as trend trading, stop loss, and take profit.
- This article provides a tutorial on how to calculate and plot the moving average in Excel using formulas and charts.
Related News

How to choose a good stock among so many stocks?
Choosing a good stock among so many stocks is not an easy task. There is no single formula or strategy that can guarantee success. Different investors may have different goals, risk preferences, and investment styles. However, there are some general principles and guidelines that can help you narrow STOCKES2026-06-29
How to systematically learn stock investment?
Systematic learning is a process of acquiring knowledge and skills in a planned and organized way. There are many ways to systematically learn stock investment, but here are some common steps that you can follow:Step 1: Learn the basics of stock market investing. Before you invest in any stocks, you STOCKES2026-07-19

Why is stock investment the most difficult industry to succeed in the world
Stock investment is one of the most challenging and competitive industries in the world, as it requires a high level of skill, knowledge, discipline, and luck to succeed. According to the web search results I found, some of the reasons why stock investment is so difficult are:The market is highly ef STOCKES2026-06-23

How beginners learn to invest in stocks
Learning how to invest in stocks can be a rewarding and profitable way to grow your wealth and achieve your financial goals. However, it can also be challenging and risky, especially for beginners who are unfamiliar with the stock market and its workings. Therefore, it is important to educate yourse STOCKES2026-06-10

What is the difference between futures and stocks? Which theory is suitable for beginners?
Futures and stocks are different types of financial assets that have different characteristics, risks, and rewards. Here are some of the main differences between them:Futures are contracts that oblige the buyer and seller to exchange an asset at a predetermined price and date in the future. Stocks a STOCKES2026-07-12

Complete Introduction to Stock Knowledge
There is no simple answer to what a complete introduction to stock knowledge would entail, as the stock market is a vast and complex topic that requires a lot of study and research. However, I can provide you with some basic information and resources that can help you get started with your investmen STOCKES2026-06-06
A Complete Collection of Classic Bottom Forms of Stocks
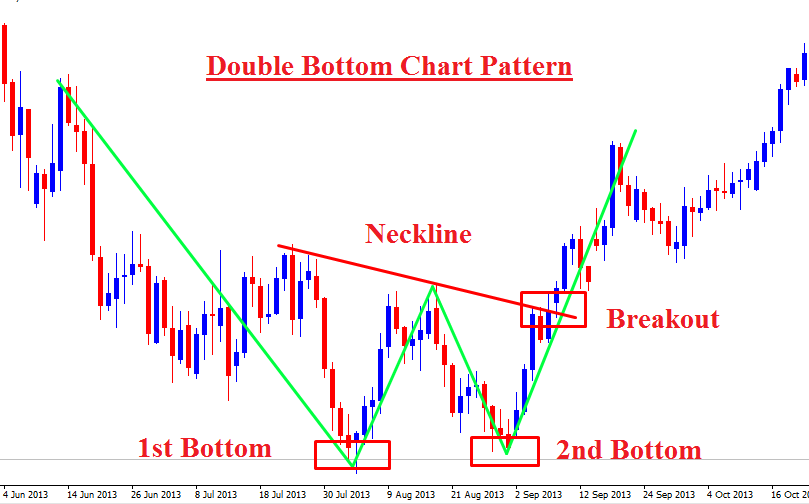
A classic bottom form of a stock is a chart pattern that indicates a reversal of a downtrend and the start of an uptrend. There are several types of classic bottom forms, such as:Double bottom: This pattern resembles the letter W, where the price falls to a low, rebounds, falls again to a similar lo STOCKES2026-07-14
Analyzing the Core Points of Choosing Stock Purchase Entry
The core points of choosing stock purchase entry are the key factors and criteria that can help investors and traders decide when and how to buy stocks that have the potential to increase in value. Different methods and strategies may have different core points, but some of the common ones are:The t STOCKES2026-07-01